Visual Complexity
Information has never been so beautiful. Visual Complexity: Mapping Patterns of Information is a new book that explores the history…

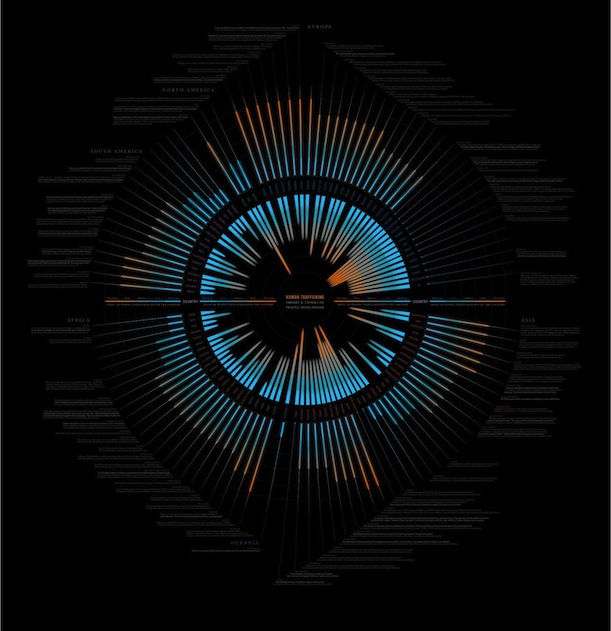
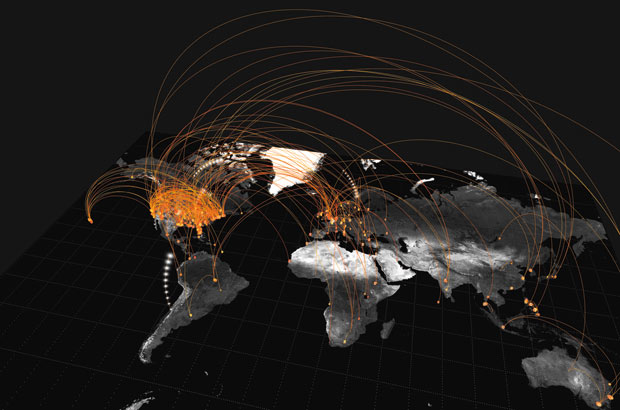
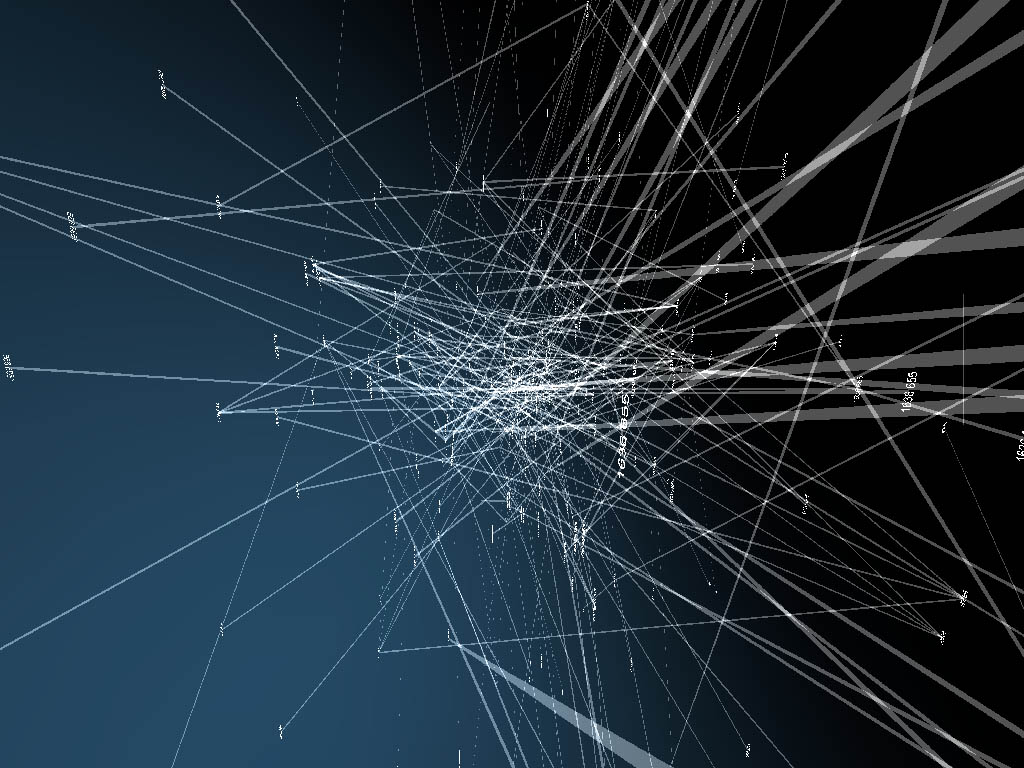
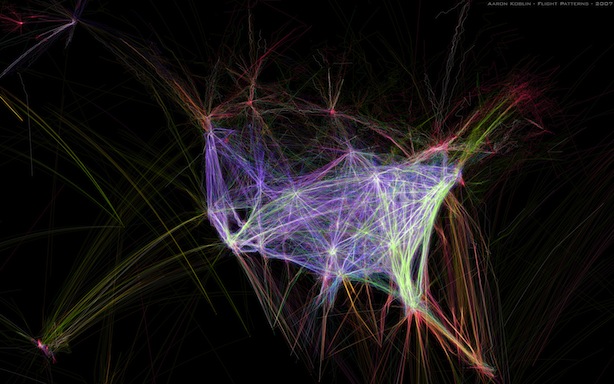
Information has never been so beautiful. Visual Complexity: Mapping Patterns of Information is a new book that explores the history of data visualisation and the shifts in how we present information in the digital age. The author Manuel Lima is a leading voice on the subject, and founder of the website Visual Complexity. His book showcases a huge collection of projects where information has been interpreted using imagery. The content ranges from politics to science to economics to social media relationships and more, visually exploring complex networks and offering analysis through intricate examination of data. Not to mention that the resulting images are stunning works of art in their own right. We recently featured Eric Fischer’s beautiful visualisations of geo-tagged tweets ‘See Something or Say Something’, a project for Visual Complexity. In the book Lima explains the methods used to create data visualisations, giving readers insight into the process and a starting point to potentially embark on their own info-graphic projects. The book shows that the art of info-graphics can be a great tool for digesting heavy amounts of data. In a modern world where access to information has never been so abundant, it is interesting to see how we can organise data visually.
Discussion