On Broadway
On Broadway turns Manhattan's social-media activity into a giant work of data visualisation

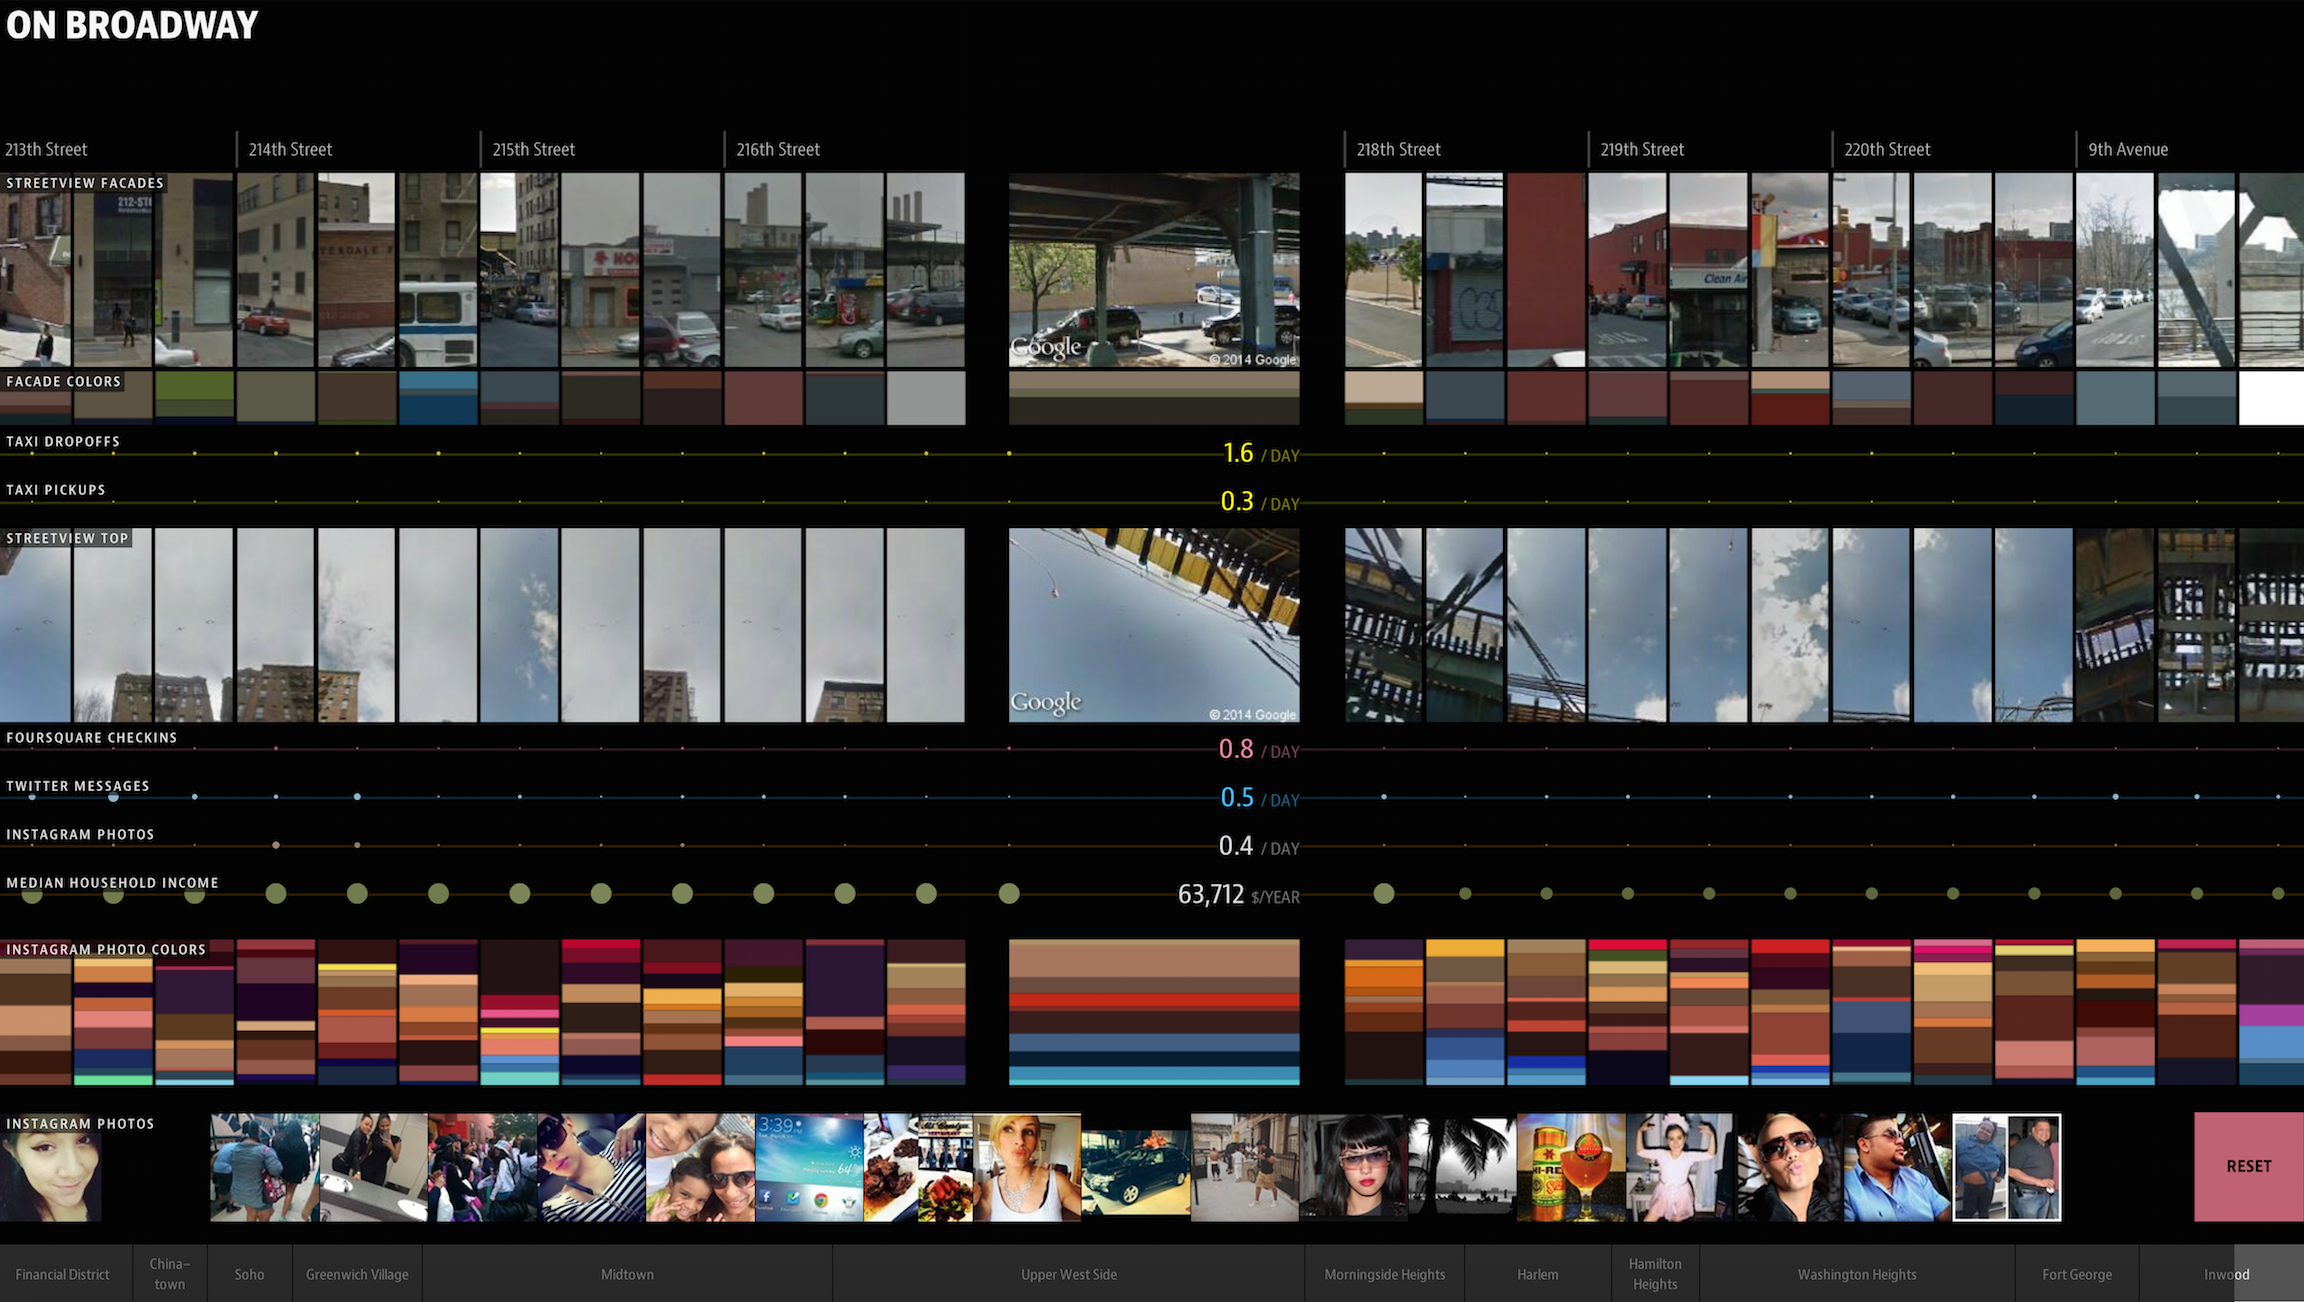
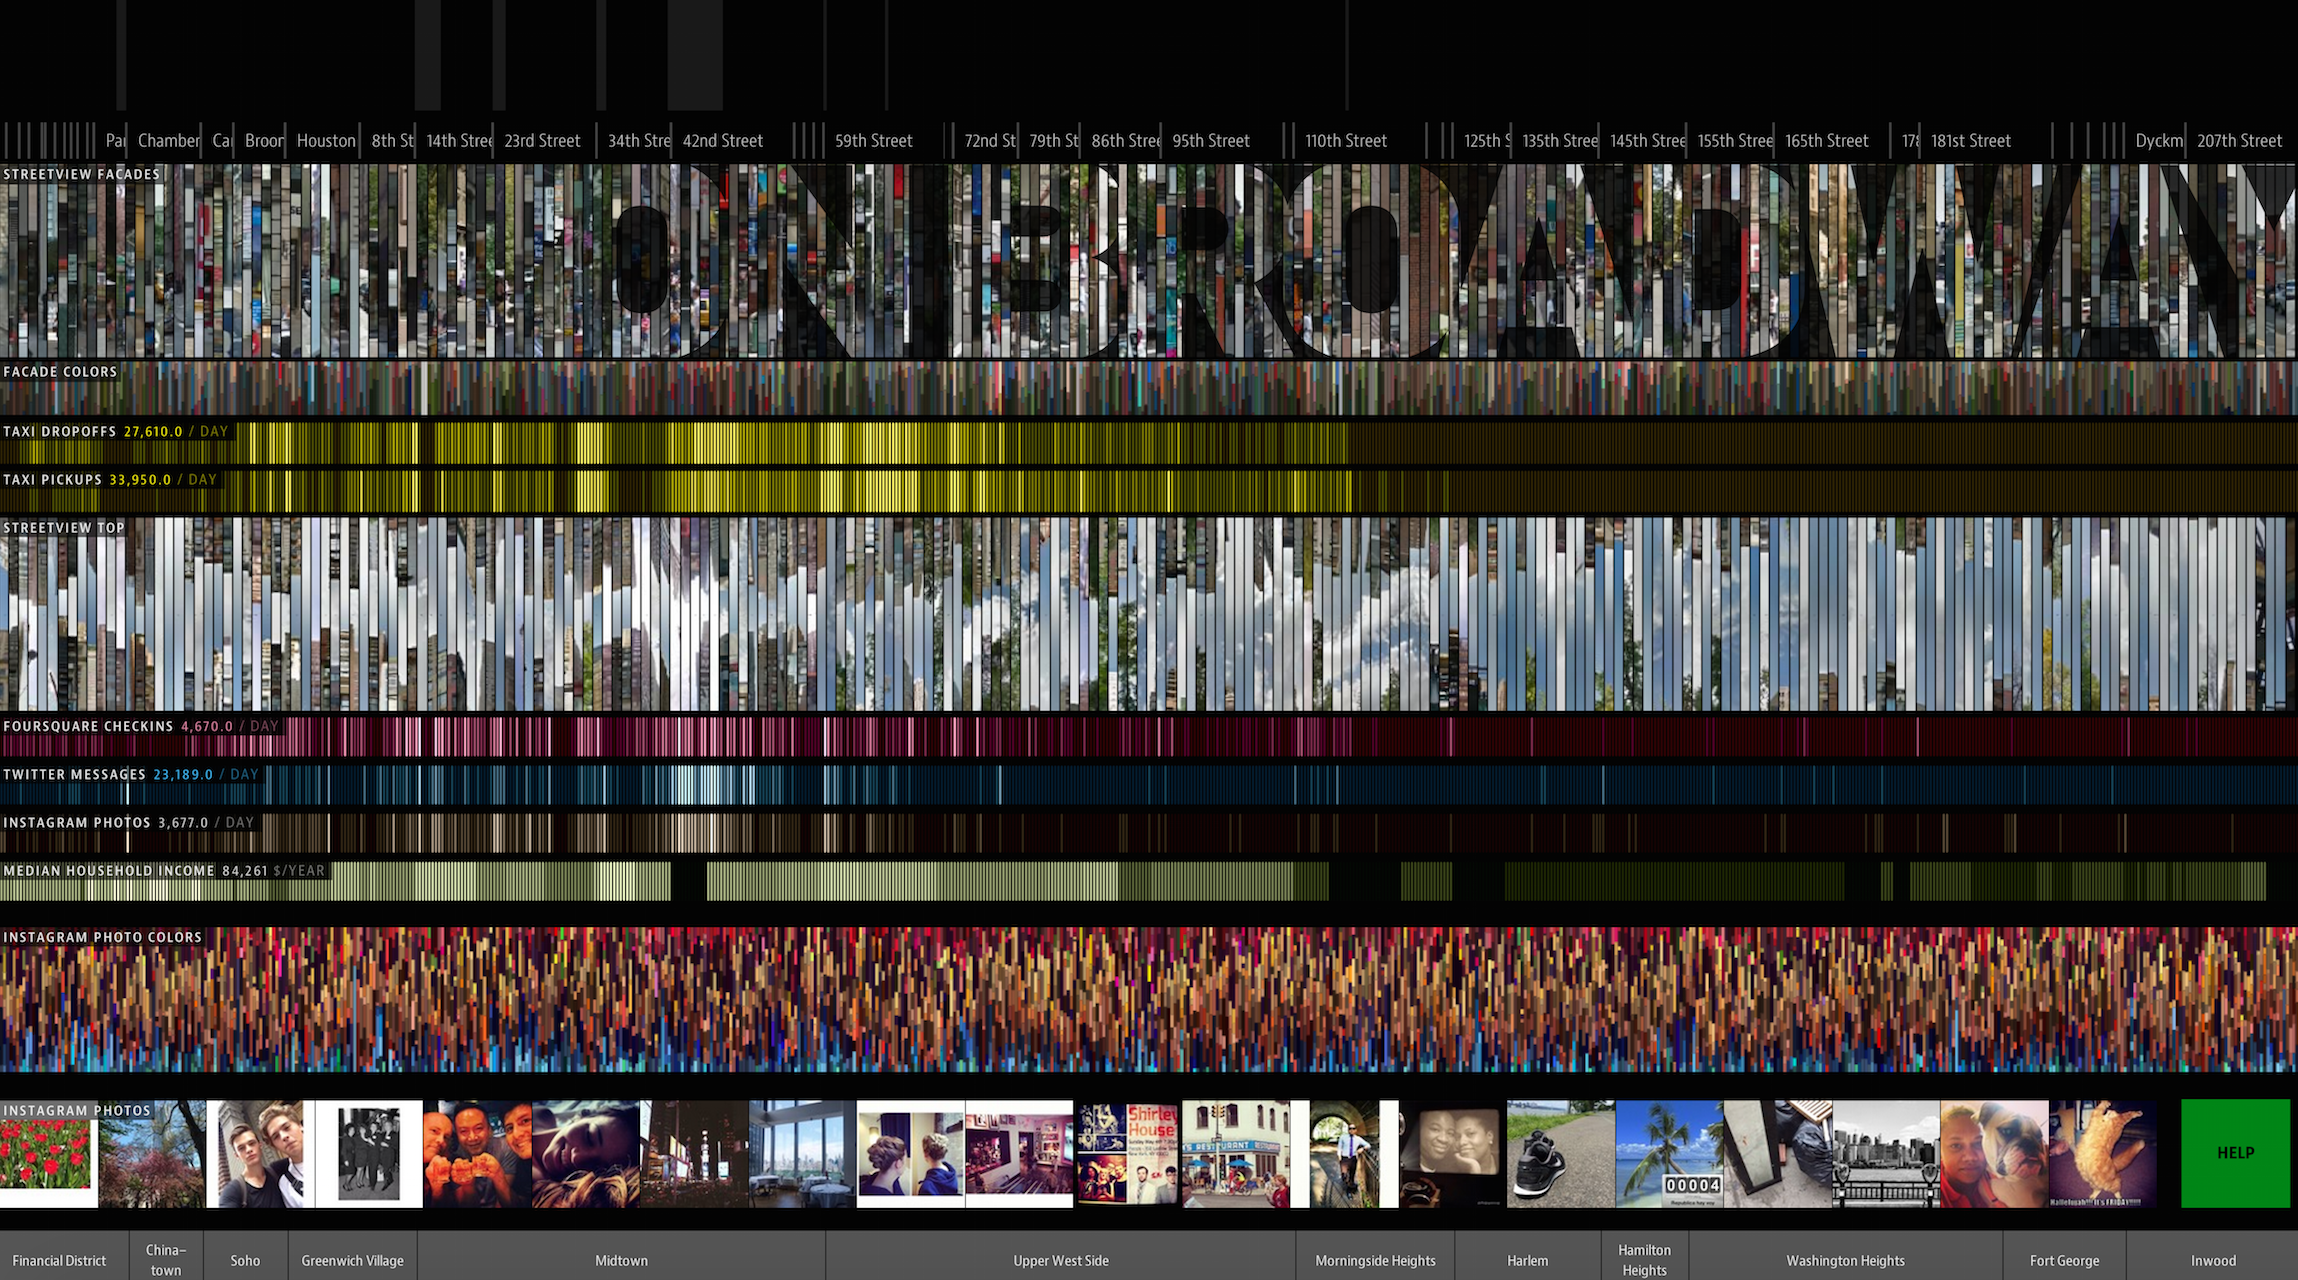
On Broadway turns Manhattan's social-media activity into a giant work of data visualisationA new project is translating Manhattan into a digital entity. On Broadway, designed by Moritz Stefaner and Lev Manovich, allows users to explore a 13-mile section of Broadway that spans NYC's most famous borough. What the interactive piece creates is a new type of city, one formed by the social media use and daily activities of its inhabitants. The whole thing works by uploading an app in your web browser. From there you can explore the 13-mile section in a number of different ways, from building colours to daily tweets. Each section of the strip has a box representing the various neighbourhoods which you can click on to learn more. It’s a mammoth project consisting of 660,000 Instagram photos, more than eight million Foursquare check-ins, 22 million taxi pick-ups and drop-offs, countless Google Street View images and Twitter posts, and economic data from the U.S. Census Bureau. Not only is On Broadway a nod towards the growing trend of interactive art and media displays, it’s a visual metaphor for thinking about the 21st century city and its community. We’ve already seen how apps are aiding community engagement and business, but On Broadway is showing how art and data visualisation can bring diverse communities and sectors together in a beautiful format.
Discussion