Google Trends
Google Trends is a hypnotic look at the hottest trends on the Internet

Data visualization presents a challenge. How can something be both highly informative and visually enthralling? Auchan's Self Scan Sustainability report, for example, aims to use smart design to make initially uninteresting data more approachable. Similarly, Google have developed Google Trends, a customizable data visualization for the most searched terms in a country.
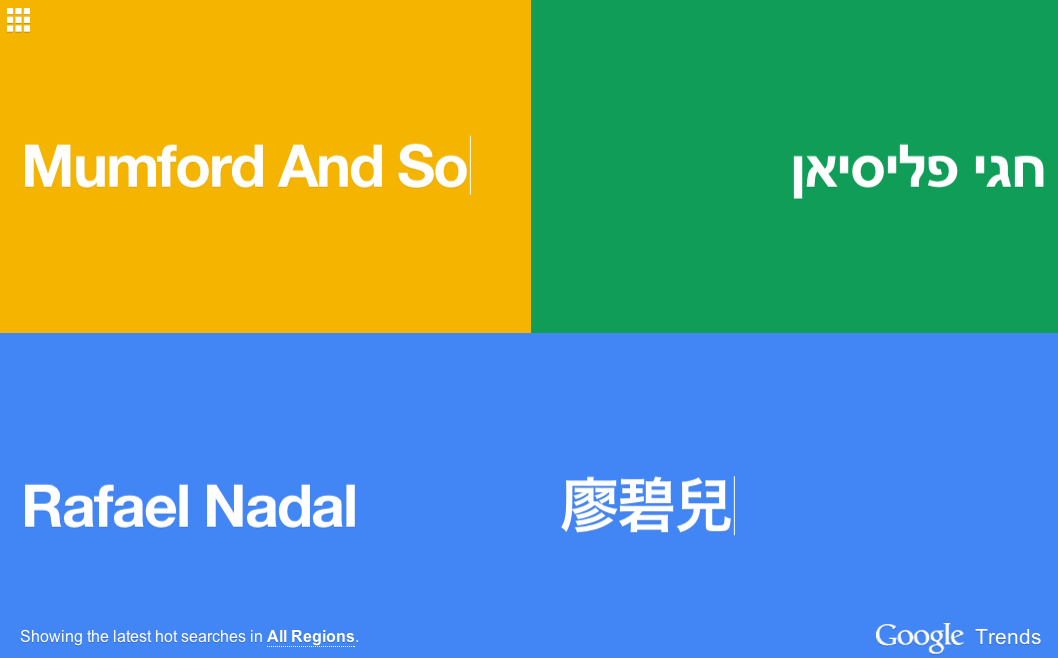
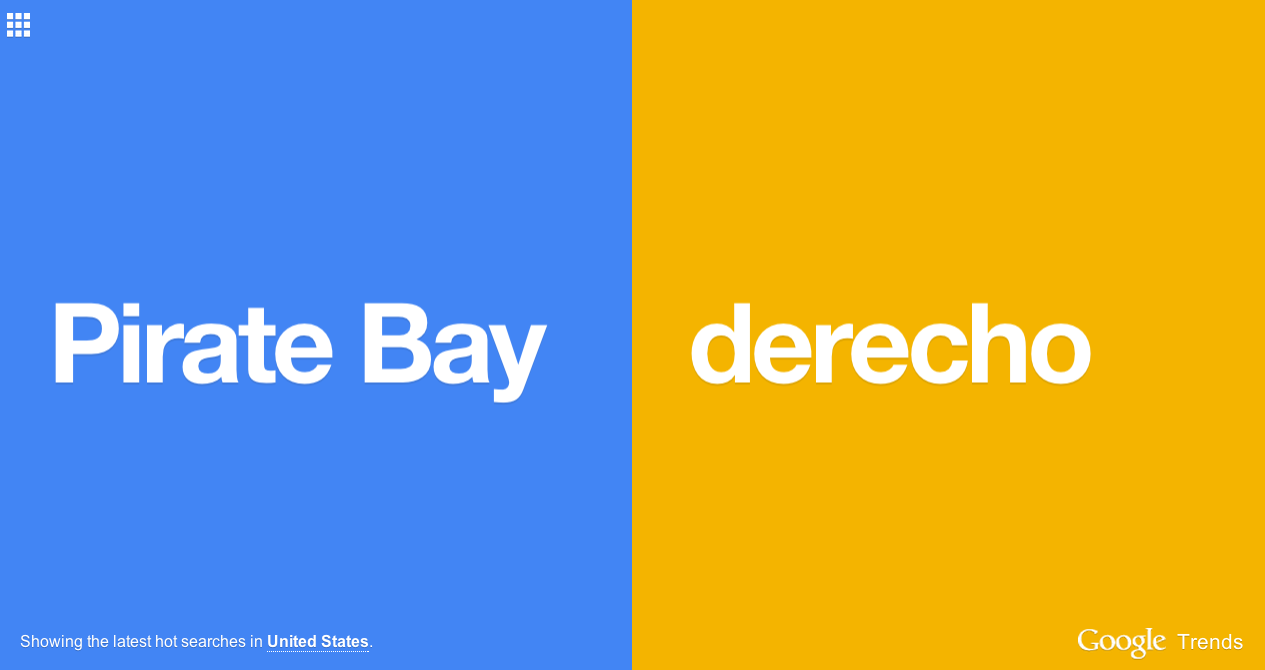
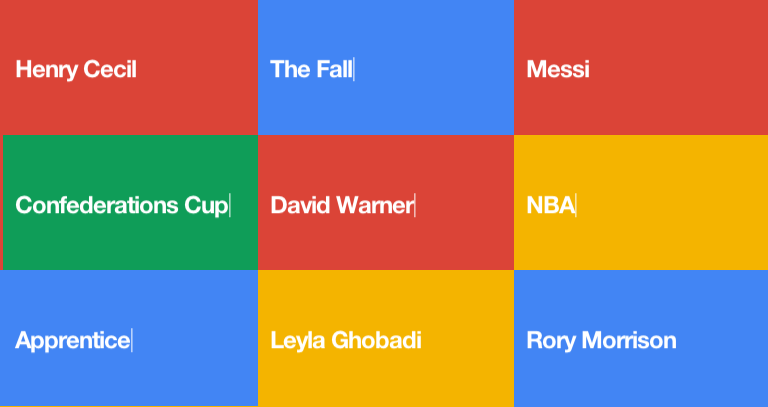
Staying true to Google’s clean, minimal aesthetics, Google Trends displays what people are searching for in real time. Users can select a single country’s search terms or view global trends on the whole. The initial solo full screen option can be broken down into 25 smaller squares, which flip rapidly through the hottest trends in an array of Google’s signature colors. Be aware, it’s dynamic nature is as mesmerizing and it is informative. You may just find yourself hypnotized.
Discussion